 |
德州 城市 社區 專訪 人物 科技 商業 醫學 教育 能源 環境 藝文 部落格 圖片故事 Houstonian Say Other Locations
特別報導回首頁 |
行政院經建會發佈專文討論馬總統上任兩年來的台灣經濟 透過參選時的政見到近期施政方向 闡述未來經濟建設之藍圖(11/15/2010)
摘要
Taiwan Economy under
President Ma's First Two
Years in Office* 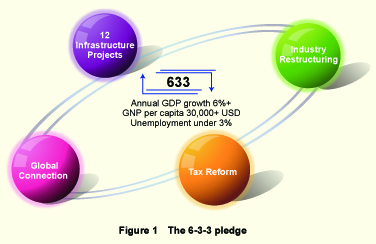 Figure 1 The 6-3-3 pledge
To achieve his goals, his economic blueprint had four dimensions: 12 basic
infrastructure projects, Global connection, Industry restructuring and Tax reform.
The reason behind the 12 infrastructure projects was due to the long term
sluggishness of the domestic demand. In addition, during Ma's election campaign,
most of the major economies were showing signs of weakness and the possibility
of slipping into recession. Hence, he believed that the future administration must
increase public investment to enhance domestic demand. 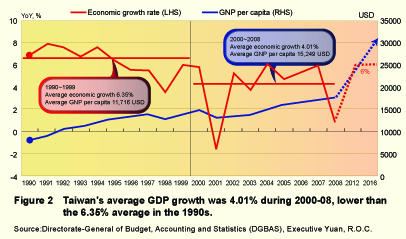 Figure 2 Taiwan's average GDP growth was 4.01% during 2000-08, lower than the 6.35% average in the 1990s. Source:Directorate-General of Budget, Accounting and Statistics (DGBAS), Executive Yuan, R.O.C. Although during the campaign, his "6-3-3" target faced enormous suspicion, such goals were not unreachable. In fact, the logic behind "6-3-3" is that Taiwan's economy may return to the growth momentum it once enjoyed in the 1990s. During the 1990s, the average annual GDP growth was 6.35%, which is significantly higher than the 4.01% average during 2000~2008. If Taiwan's economy can grow at an annual 6% with a 2% annual inflation, based on Taiwan's per capita GDP of 17,507 USD in 2008, Taiwan's per capita GDP could top 32,000 USD in 2016 (Figure 2). In fact, if Taiwan's economy can grow by more than 6% annually, the unemployment rate can drop to the late 1990 levels, which is 3% (Figure 3). 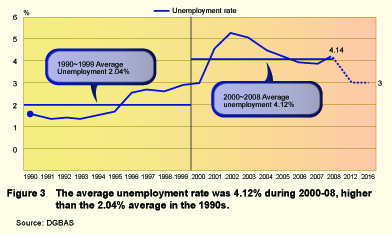 Figure 3 The average unemployment rate was 4.12% during 2000-08, higher than the 2.04% average in the 1990s.
2. Taiwan Economy since Ma Took Office 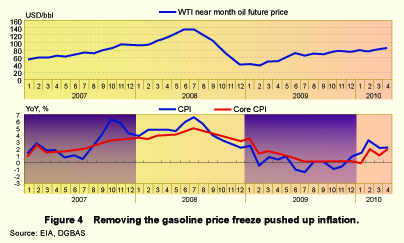 Figure 4 Removing the gasoline price freeze pushed up inflation. Although international commodity prices fell sharply since July 2008, a bigger sub-prime turmoil and the following financial crisis seriously struck Taiwan, which has always relied heavily on external demand. Noteworthy, the correlation coefficient of Taiwan export annual growth and the world trade volume annual growth during 2000 thru 2010 has been at a high of 0.87. This naturally explains why Taiwan's exports fell sharply by 9.21% in 2009 (Figure 5). 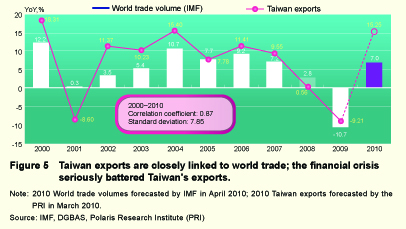 Figure 5 Taiwan exports are closely linked to world trade; the financial crisis seriously battered Taiwan's exports. The sharp export declines significantly impacted Taiwan's manufacturing industry, which dragged Taiwan into a recession for 5 consecutive quarters. The trough seems to have occurred during 1Q09, when the GDP declined 9.08% year-on-year. Amid the deepening recession, the unemployment rate worsened as well, rising from 3.84% in May 2008 to 6.13% in Aug 2009 (Figure 6). 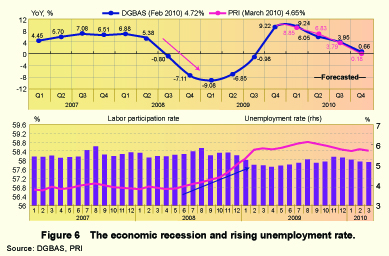 Figure 6 The economic recession and rising unemployment rate. In addition to the crisis of lifting the price freeze and eruption of the global financial crisis, the Sanlu contaminated milk powder event of Sept. 2009, the H1N1 flu pandemic of Mar. 2009, the disaster inflicted by Typhoon Morakot in Aug. 2009 and the internal controversy over the agreement to loosen the limits on US beef imports all contributed to the drop of President Ma's approval rates, resulting in Ma's administration to be unable to focus on realizing his campaign prospects (Figure 7). 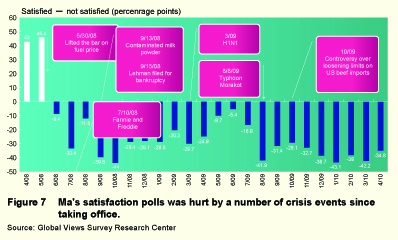 Figure 7 Ma's satisfaction polls was hurt by a number of crisis events since taking office.
2.2. Crisis Management 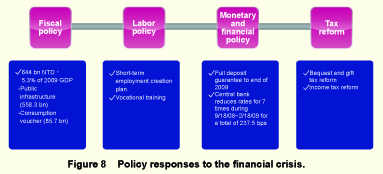 Figure 8 Policy responses to the financial crisis. Benefiting from the sprouts of recovery in the global economy and the government stimulus package taking effect, the Taiwan economy started to recover in 2Q09. More importantly, with the recovery gradually getting back on track, the DGBAS has for four times revised upward the forecast of Taiwan's economic growth for 2010 since Aug. 2009 (Figure 9). 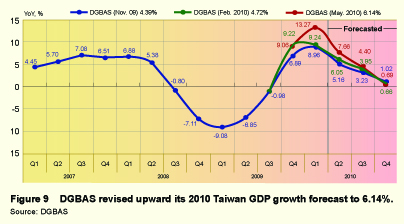 Figure 9 DGBAS revised upward its 2010 Taiwan GDP growth forecast to 6.14%. Aside from the DGBAS, recently other major institutes have also revised upward their Taiwan economic growth forecasts. Among which, Global Insight raised their forecasts for Taiwan's growth in 2010 to 6.6% on June 2010 from the 5.3% on May 2010, and the Polaris Research Institute revised upward its forecasts for Taiwan's growth in 2010 to 6.82% on June 2010. The ADB and the IMF also further lifted their forecasts to 4.9% and 6.5% respectively, on April 2010 (Figure 10). 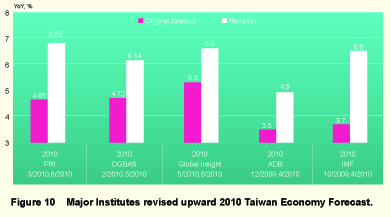 Figure 10 Major Institutes revised upward 2010 Taiwan Economy Forecast. Battered by the recession, the number of accumulated job losses amounted to 238,000 people from Aug 2008 to April 2009. But thanks to the gradual recovery that started in 2Q09, the number of accumulated job losses fell to 80,000 people, which marked a big improvement. Although the unemployment rate remains high, conditions have improved evidently (Figure 11). 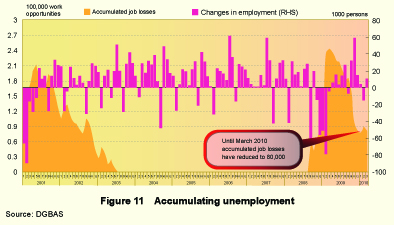 Figure 11 Accumulating unemployment
It should be noted that, the policy measures and their success come at a cost. 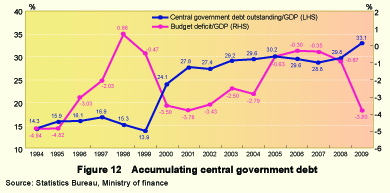 Figure 12 Accumulating central government debt
3. Prospects of the Taiwan Economy 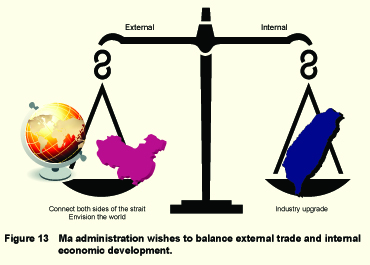 Figure 13 Ma administration wishes to balance external trade and internal economic development.
These two policies are both vital to Taiwan. Afterall, in the pursuance of freer
trade, based on comparative advantage considerations, the migration of various labor
intensive industries is a natural outcome. However, if Taiwan can at the same time
take advantage of the expanded overseas market space and aggressively support
industrial upgrade and play critical roles in the global supply chain, it may prove to be
beneficial to the sustainable development of the island. 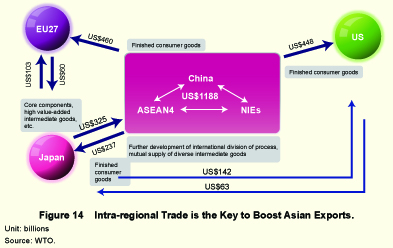 Figure 14 Intra-regional Trade is the Key to Boost Asian Exports.
Noteworthy, by comparing the export destination of major economies, we can
see the prosperous development of the manufacturing process division among Asian
nations. In terms of Asia as a whole, intra-Asia trade has accounted for over 57.5%
of total trade. Although slightly lower than the 67.2% of the European Union, it is
11.9 percentage points higher compared to 1990, and is much higher than the -0.3
percentage point change in the EU and the 8.1 percentage point increase in NAFTA
over the same period. Among Asia, the share of NIEs and Japan exports to Asia have
reached 63.6%, which is a 20.1 percentage point increase from 1990, thereby showing
that these nations have actively joined the intra Asia manufacturing process division
(Chart 1). 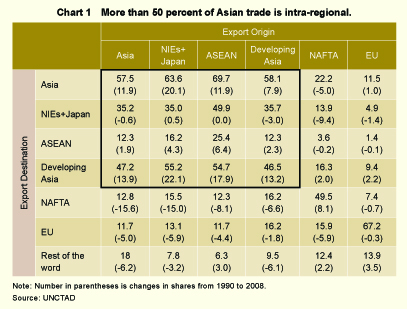
If we further look at the structural change in intra-Asian trade, we can see that
China is the key influencing factor. In 2008, exports to China increased the most
compared to 1990 from all the NIEs, ASEAN and developed Asia (mainly Japan),
where the share increased by 15.9, 7.8 and 12.9 percentage points, respectively. In
Refocusing on the internal side, aggressive participation in the process of global
division of labor will inevitably cause some industries with comparative disadvantages
to move out. Since many of these are traditional manufacturing industries that employ
a great number of workers, the government must take the issue seriously or it may
cause panic over unemployment concerns. To cope with the challenge, Ma's team
has planned three dimensions for industrial restructuring: industry renewal, emerging
industries and deregulation (Figure 15). Among which, there are two goals in industry
renewal, which is: 1. Upgrade of the service sector to absorb the excessive labor
during the process of industry transition; 2. Increase the added value of manufacturing
industries and developing agricultural technologies to cope with the competition from
nearby countries once trade is freer. 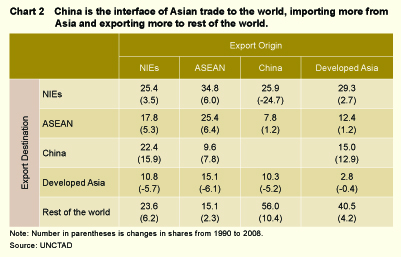 Refocusing on the internal side, aggressive participation in the process of global division of labor will inevitably cause some industries with comparative disadvantages to move out. Since many of these are traditional manufacturing industries that employ a great number of workers, the government must take the issue seriously or it may cause panic over unemployment concerns. To cope with the challenge, Ma's team has planned three dimensions for industrial restructuring: industry renewal, emerging industries and deregulation (Figure 15). Among which, there are two goals in industry renewal, which is: 1. Upgrade of the service sector to absorb the excessive labor during the process of industry transition; 2. Increase the added value of manufacturing industries and developing agricultural technologies to cope with the competition from nearby countries once trade is freer. In addition to the industries where Taiwan has a strong competitiveness, the government has also laid out plans for the recreation and culture segments, green energy and low emissions sector, smart living industry, and biotech and health care sectors to serve as Taiwan's long term industry development. To make this achievable, in addition to the subsidies given to specific industries by the Executive Yuan, the more important task is to deregulate relevant restrictions. 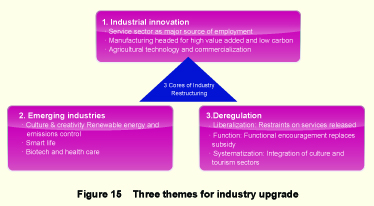 Figure 15 Three themes for industry upgrade Another aspect of deregulation which recently has become a frequently discussed issue is the tax reform. The planned tax reform has four dimensions (Figure 16). In addition to the previously mentioned income tax and bequest and gift tax, in the newly passed corporate profit tax reform, the industry specific grants were replaced by functionality based subsidies that provided incentives for investment. In addition, the corporate profit tax rate was lowered to 17% from 25% to enhance international competitiveness. The government has also planned for a green taxation system for the future to promote Taiwan's development in green technology and low emissions industry. 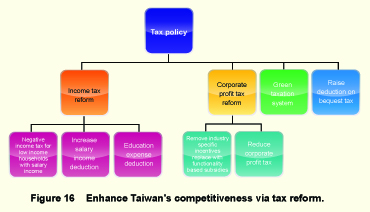 Figure 16 Enhance Taiwan's competitiveness via tax reform.
3.2. Outlook of Taiwan Economy for 2010 & 2011 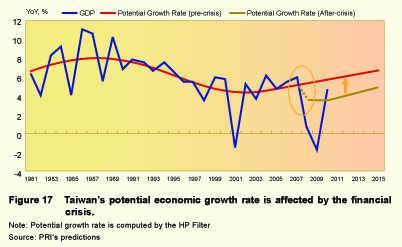 Figure 17 Taiwan's potential economic growth rate is affected by the financial crisis. In fact, IMF has been holding a more optimistic view among currently available opinions regarding Taiwan's economic growth for the next few years. According to the World Economic Outlook report it released in April 2010, Taiwan's average growth rate during 2010~2015 is projected to reach 5.20%, higher than the projections for Singapore, Hong Kong and South Korea for the same period, at 5.0%, 4.4% and 4.3%, respectively. Based on IMF's projections, Taiwan's per capita GDP could reach 28,000 USD and unemployment rate could fall to 3.1% in 2016 (Figure 18). 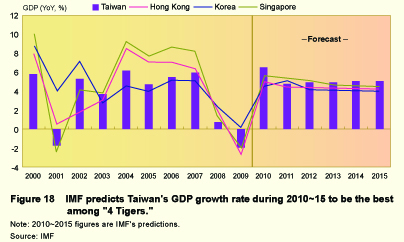 Figure 18 IMF predicts Taiwan's GDP growth rate during 2010~15 to be the best among "4 Tigers." * This paper is an updated version of a speech delivered on May 18, 2010 at the Brookings Institution, Washington D.C., USA for a Joint Symposium entitled "A Mid-Term Assessment of the Policies of the Ma Ying-Jeou Administration" which was organized by The Freeman Chair Studies at the Center for Strategic and International Studies, The Center for Northeast Asian Policy Studies at the Brookings Institution, and The John L. Thornton China Center at the Brookings Institution. (文稿資料由經文處商務組提供) ( 回首頁 Houston eWIND ) | . |
| Copyright © 2010 Houston eWIND. All rights reserved. |